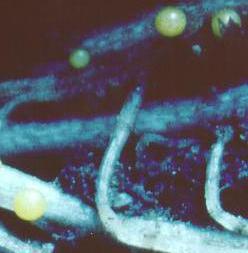
incl. a description of data source & evaluation methods
| Cyst and Root-knot Nematodes | VR | R | M | S | VS | total |
| Globodera rostochiensis: Ro1 | 1 | 45 | 6 | 514 | 566 | |
| Ro2 | 8 | 1 | 165 | 174 | ||
| Ro3 | 3 | 2 | 11 | 16 | ||
| Ro5 | 46 | 48 | 205 | 299 | ||
| Ro1-5 | 15 | 11 | 56 | 82 | ||
| G. pallida: Pa1 | 30 | 4 | 7 | 41 | ||
| Pa2 | 121 | 118 | 290 | 529 | ||
| Pa3 | 2 | 250 | 76 | 368 | 9 | 705 |
| Pa2/3 (by INRA) | 10 | 6 | 37 | 53 | ||
| Meloidogyne chitwoodi | 8 | 1 | 1 | 77 | 87 | |
| M. fallax | 8 | 3 | 2 | 72 | 85 | |
| M. hapla | 15 | 11 | 67 | 93 | ||
| Fungal diseases | VR | R | M | S | VS | total |
| Late blight field test (Phytophthora infestans) | 73 | 158 | 235 | 403 | 817 | 1686 |
| Late blight laboratory test | 103 | 82 | 103 | 120 | 849 | 1257 |
| Wart R1 (Synchytrium endobioticum) | 57 | 34 | 122 | 213 | ||
| Wart R2 | 71 | 52 | 60 | 183 | ||
| Wart R6 | 94 | 104 | 92 | 290 | ||
| Wart R8 | 91 | 61 | 84 | 236 | ||
| Gangrene (Phoma exigua var. foveata) | 99 | 121 | 190 | 410 | ||
| Dry rot (Fusarium coeruleum) | 76 | 72 | 304 | 452 | ||
| Rhizoctonia solani | 3 | 4 | 5 | 12 | ||
| Common scab (Streptomyces scabies) | 20 | 20 | ||||
| Virus diseases | I | IS | S | VS | total | |
| PVX | 25 | 43 | 60 | 97 | 225 | |
| PVY | 2 | 13 | 36 | 184 | 235 | |
| R | M | S | VS | total | ||
| PVM | 9 | 7 | 190 | 206 | ||
| Bacterial diseases | VR | R | M | S | VS | total |
| Blackleg (Pectobacterium atrosepticum) | 327 | 133 | 67 | 31 | 558 | |
| Softrot (P. atrosepticum) | 3 | 12 | 66 | 81 | ||
| Other | range | total | ||||
| Reducing sugar content | 35-2838 mg/100g tuber | 337 | ||||
| Dry matter content | 14 - 44.5 % | 348 | ||||
| Starch content | 9.2 - 37.1 % | 195 | ||||
| Vitamin-C content | 32 - 128 ppm | 74 | ||||
| T | M | S | VS | total | ||
| Salt tolerance | 4 | 4 | 28 | 22 | 58 | |
| TOTAL number of evaluation results: | 9806 | |||||
Results for cyst-nematodes (Globodera rostochiensis (Woll.) Stone, G. pallida Stone) have been
obtained from the following sources:

The procedure for testing the resistance was described by Huijsman (1957) and Ross & Huijsman (1969).
Samples of 15-40 plants per accession are tested.
Screening methods used:
The second is a simple method and almost all screenings were conducted that way. However, some of the earlier testings were
conducted in infested soil. INRA-Ploudaniel used the third method, the more reliable one. In Europe at present 5 virulence groups
of G. rostochiensis and 3 of G. pallida are recognised. To obtain standardization the earlier results (from
Ross & Huijsman, 1969; and Hermsen & Verdenius, 1971) had to be adapted to the scheme of Kort et al. (1977).
For the more recent data, the number of plants with 0 cysts (Pa2) and 0-2 cysts (Pa3, 1981-1985) in relation to the total number
of screened plants, is available too. In the root ball test only the outside of the root ball is screened on the presence of cysts,
but when performed under sub-optimal growing conditions (winter season) also the inner root ball was visually examined.
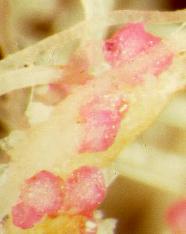
Root-knot nematodes
Results on Meloidogyne hapla, M. chitwoodi and M. fallax were received from CPRO and published by Janssen et al. (1996).
During the investigations a new Meloidogyne species was identified deviating from M. chitwoodi, which has been described
as M. fallax (Karssen, 1996).
Screening method used: 3-5 weeks after sowing about 600 nematode juveniles were supplied around
the base of the seedling. After 7 weeks the roots of the plants were stained and egg masses counted. When less than 6 egg masses were found,
then the test was repeated using a stem cutting of the plant. A genotype is scored as resistant when it showes less than 6 egg masses on the roots.
Since 1 May 1997 M. chitwoodi and M. fallax are quarantine organisms in the EU. To prevent spread, any planting material needs
to be free of these two root-knot nematode species.
Late blight
In the screening for late blight (Phytophthora infestans) resistance one hopes to find non-specific (horizontal or partial) resistance. Evaluation results have been obtained from following sources:
Field test
In 3 field plots of 4-8 plants, the seedlings were inoculated early July.
Until 1983 a mixture of the pathotypes 1.2.3, 1.3.4 and 1.4.11 was used; 1984 a mixture of the pathotypes 1.2.3.7, 1.3.4.7.10 and
1.4.10.11 was used; 1985 the pathotype 1.3.4.7.10 was mixed with a complex pathotype (P1) with unknown virulence genes; 1986 &
1987 the pathotype 1.2.3.4.5.7.10.11 was used, and from 1988 onwards the complex pathotype 1.2.3.4.5.6.7.10.11 with a concentration
of 50 zoospores/mm3 was used. The latter pathotype originates from Gembloux (Belgium, 1982) and has good chances to break
through (known) monogenic resistance genes. To obtain optimum inoculation conditions, the field was sprayed with a sprinkle system.
All accessions are screened weekly for their percentage infected foliage. The results are reduced by the principle of the "weighted
mean" (WM) and devided by 10 to get figures from 0-9 (van Soest et al., 1984).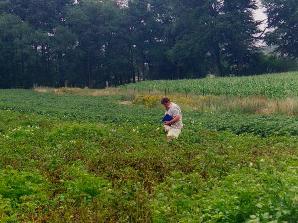
For the import of the results into the GENIS database, the original WM values were multiplied by 10 to
restore the unit PERCENTAGE (infected foliage). The WM values of the susceptible variety Bintje are: 59.8 (1975), 62.5 (1976), 55.2
(1977), 55.5 (1979), 62.4 (1981), 57.5 (1982), 52.2 (1983) and 52.1 (1984); those of Bildstar are: 55.1 (1986), 71.2 (1987), 65.6
(1988), 59.2 (1989), 55.8 (1997), 44.8 (1998) and 43.7 (1999); those of Eersteling are: 69.5 (1986), 78.6 (1987), 72.1 (1988), 66.5
(1989), 60.8 (1997), 60.6 (1998) and 51.0 (1999); and of Ostara: 59.2 (1989), 56.3 (1997), 44.4 (1998) and 45.3 (1999). The WM values
of the more tolerant variety Pimpernel (without R-genes) are: 23.1 (1974), 28.6 (1975), 30.3 (1976), 21.6 (1981), 21.8 (1983), 27.6
(1984), 29.9 (1986), 41.8 (1987), 47.1 (1988), 27.3 (1989), 32.5 (1997), 23.4 (1998) and 17.2 (1999). Because of the too positive
results of the standard varieties in 1998 and 1999, the results of these two years were adapted accordingly (WM values multiplied
with factor 1.3 ). For the opposite reason the results of 1984 were multiplied with 0.77 .
Due to a simplification of the screening method no WM-values are available from 1985 (16 plants / accession were screened twice
with a time interval of a week, in a phase with representative differences in susceptibility). The figures received from CPRO in
1985 were multiplied with 0.6 , to get figures that are 'in-line' with the usual WM results. 1997 also ADPC values were calculated.
The WM and ADPC values are coded as follows:
| Code | Level of susceptibility | WM-Index | ADPC |
| VR | very low | 0.0 - 6.0 | 0.00 - 0.07 |
| R | low | 6.1 - 18.0 | 0.08 - 0.22 |
| M | intermediate | 18.1 - 30.0 | 0.23 - 0.36 |
| S | high | 30.1 - 42.0 | 0.37 - 0.49 |
| VS | very high | > 42.0 | > 0.49 |
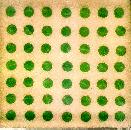
| Code | Level of susceptibility | Sporulation index |
| VR | very low | 0 - 3.9 |
| R | low | 4 - 19.9 |
| M | intermediate | 20 - 39.9 |
| S | high | 40 - 59.9 |
| VS | very high | > 60 |
| Code | Meaning of code |
| R | resistant |
| M | intermediate |
| S | susceptible |
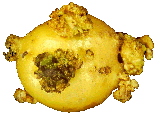
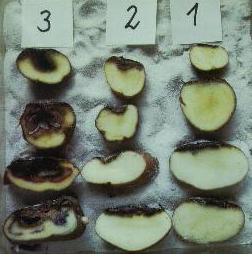 Results for gangrene (Phoma exigua var. foveata) have been obtained from the Biologische Bundesanstalt
(BBA), Institut f r Pflanzenschutz in Ackerbau und Gr nland, Braunschweig. Material tested in 1986-1994. Results were discussed by Langerfeld
& Hoekstra (1994).
Results for gangrene (Phoma exigua var. foveata) have been obtained from the Biologische Bundesanstalt
(BBA), Institut f r Pflanzenschutz in Ackerbau und Gr nland, Braunschweig. Material tested in 1986-1994. Results were discussed by Langerfeld
& Hoekstra (1994).| Code | Meaning of code | Infection index |
| R | resistant | < 1.30 max 30% tubers rottening |
| M | intermediate | 1.31-1.80 31-70% tubers rottening |
| S | susceptible | > 1.80 > 70% tubers rottening |
| Code | Meaning of code |
| R | resistant |
| M | intermediate |
| S | susceptible |
Institute for Potato Research, Department of Genetics, Mlochow, Poland. 10-20 plants per accession were tested. Scions of each plant were grafted on tomato plants infected with PVM (isolate Uran) (Dziewonska & Ostrowska, 1978). The screening is based on the percentage of plants in which PVM was detected 6 weeks after grafting on infected tomato plants. Plants apparently not infected were retested. The results are presented as follows:
| Code | Meaning of code |
| R | < 40 % of grafted plants infected |
| M | > 40 % of grafted plants infected |
| S | all grafted plants infected |
Potato virus X
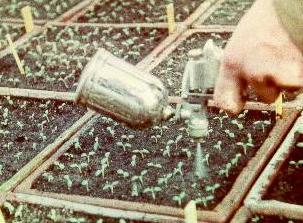
Stichting voor Plantenveredeling (SVP, later merged into CPRO, since 2000 Plant Research International), Wageningen.
Material tested in 1978, 1979, 1982 - 1984. Preliminary screening for extreme resistance of samples of 50-100 seedlings, started
3 weeks after inoculation. The inoculation of the seedlings at the cotyledon stage with a spray-gun was described by Wiersema (1961).
The final testing of seedlings by means of grafting on tomato stocks is not included in this test.
The results are presented as follows:
| Code | Meaning of code |
| I | 0 - 5 % of the plants with PVX symptoms |
| IS | 6 - 30 % of the plants with PVX symptoms |
| S | 31 - 70 % of the plants with PVX symptoms |
| VS | > 70 % of the plants with PVX symptoms |
Material tested by the Stichting voor Plantenveredeling (SVP, later merged into CPRO, since 2000 Plant Research International),
Wageningen in 1978, 1979, 1982 - l984. Preliminary screening for extreme resistance of samples of 50-100 seedlings, started 3 weeks
after inoculation. The inoculation of the seedlings at the cotyledon stage with a spray-gun was described by Wiersema (1961). The final
testing of seedlings by means of grafting on tomato stocks is not included in this test.
The results are presented as follows:
| Code | Meaning of code |
| I | 0 - 5 % of the plants with PVY symptoms |
| IS | 6 - 30 % of the plants with PVY symptoms |
| S | 31 - 70 % of the plants with PVY symptoms |
| VS | > 70 % of the plants with PVY symptoms |
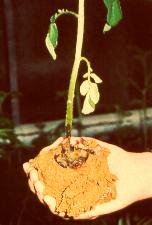
Material tested on blackleg (Pectobacterium atrosepticum (van Hall) Gardan et al. {syn. Erwinia carotovora (Jones) Hol. subsp. atroseptica (van Hall) Dye.}) by the Bayerische Landesanstalt f r Bodenkultur und Pflanzenbau (now Bayerische Landesanstalt f r Landwirtschaft: LfL), Freising in 1977-1993. Results were discussed by Hoekstra & Munzert (1990). The method is described by Munzert (1975). Three weeks old tuber eye cuttings are inoculated with filter paper covered drawing-pins, previously dipped in a bacterial suspension of 5 x 10⁸ bact./ml. After approximately 10 days the first blackleg symptoms become visible. Three weeks after the inoculation the test is stopped and the plants are scored for presence of blackleg. 10-40 tubers per accession are tested.
The data are coded as follows:
| Code | Level of susceptibility | % Blackleg |
| R | low | < 5.9 |
| M | intermediate | 6.0 - 20.9 |
| S | high | 21.0 - 40.0 |
| VS | very high | > 40 |
Results on softrot (Pectobacterium atrosepticum (van Hall) Gardan et al. {syn. Erwinia carotovora (Jones) Hol. subsp. atroseptica (van Hall) Dye.}) evaluations obtained from INRA-Ploudaniel, published by Rousselle-Bourgeois & Priou (1995). The aggressive strain Eca 86.20 from Brittany was used to inoculate the biggest tubers available just after harvesting. The test was adapted from Austin el al. (1988). Sterile pipette tips containing 10 l of bacterial suspension (108 cfu/ml) were pressed into the tuber to a depth of 1 cm. Incubation period: 6 days at 20 C. Progeny of uninfected genotypes were retested the year after.
Following 3 traits were evaluated by the Bundesanstalt f r Getreide-, Kartoffel- und Fettforschung, Institut f r St rke- und Kartoffeltechnologie, Detmold, Germany (BAGKF; since 2008 Department of Safety and Quality of Cereals and part of the Max Rubner-Institut).
Vitamin C content
Vitamin C content of some Solanum tuberosum subsp. andigena clones, data from the WAC inventory (Hermsen &
Verdenius, 1971) expressed in ppm (parts per million). The mean vitamin C content of potato varieties is about 20 mg/100 g freshly
harvested tubers, and it rapidly declines to about 8-10 mg/100 g tuber in storage (CIP, 1974). The contents scored range from 3,2 to
12,8 mg/100 g tuber.
Salt tolerance
Evaluation results from Elhag (1991)
on 58 genbank accessions and 11 potato varieties. From each accession 1 genotype was multiplied in vitro. The in vitro test was
carried out with 0, 40, 80 and 120 mMol NaCl in the growth medium (7 replications; 6 weeks; 16 hours 4000 lux; 20-23 C). Shoot length
appeared to be a good parameter to determine the salt tolerance in the in vitro test. The results from the lower salt concentration
(40 mM) were not used for the classification below
Classification:
The accessions were classified as follows,
using the mean value of the relative shoot lengths (as % of untreated) from the 80 and 120 mM sodium chloride treatments.
|
|
Mean shoot length (%) |
| T (tolerant) |
|
| M (interMediate) |
|
| S (susceptible) |
|
| VS (very susceptible) |
|
| BGRC Accession / Clone | CGN no. | 80 mM NaCl | 120 mM NaCl | Score |
|
16979 chacoense |
17898 |
72 |
60 |
T |
|
24687 sparsipilum |
18099 |
70 |
59 |
T |
|
15451 vernei |
17836 |
69 |
57 |
T |
|
16837 gourlayi |
17853 |
66 |
53 |
T |
|
24717 tarijense |
18107 |
64 |
52 |
M |
|
18326 spegazzinii |
18034 |
64 |
50 |
M |
|
28043 TBR ssp.andigena |
18233 |
59 |
48 |
M |
|
7463 TBR ssp.andigena |
17619 |
57 |
44 |
M |
| Desiree | - | 62 | 49 | M |
| rel. shoot length (%) | rel. shoot dry weight (%) | Score | ||||
| Accession / Clone | CGN no. | 120 mM NaCl | 160 mM NaCl | 120 mM NaCl | 160 mM NaCl | (by Elhag) |
| 24687 sparsipilum |
18099 |
61 |
7 |
62 |
18 |
T |
|
16979 chacoense |
17898 |
60 |
4 |
57 |
23 |
T |
|
24717 tarijense |
18107 |
54 |
4 |
62 |
17 |
T / M |
|
15451 vernei |
17836 |
48 |
11 |
52 |
24 |
M |
|
CIP: Aracy TBR ssp.tuberosum |
- |
47 |
21 |
57 |
31 |
M |
|
28043 TBR ssp.andigena |
18233 |
45 | 5 | 52 | 19 | M |
| CIP: DTO-28 TBR ssp.tuberosum | - | 26 | 5 | 54 | 16 | S |
| CIP: 7XY-1 TBR ssp.tuberosum | - | 26 | 5 | 48 | 23 | S |
| CIP: CFC-69.1 TBR ssp.tuberosum | - | 26 | 6 | 44 | 12 | S |
| CIP: LT-8 TBR ssp.tuberosum | - | 21 | 0 | 34 | 0 | S |
Feedback to: Lana.deBruijn@wur.nl,
Centre for Genetic Resources the Netherlands (CGN), Wageningen, the Netherlands.